Table of Contents
In this post, we will learn how to view application logs for our AppEngine application, as well as view metrics for throughput, latency and resource usage.
After deploying an App Engine service, we need to monitor its performance, and find out if there are any errors being logged.
App Engine, together with tools like Cloud Monitoring and Cloud Logging, gives us the ability to effectively monitor and debug our application.
The best part is that most of this functionality is provided out of the box — we don’t need to install anything extra after deploying our application.
Deploying a Sample Application
First, we need to build and deploy our application into App Engine.
To illustrate this, we can deploy a sample Java application that contains two HTTP routes:
GET /simple-request- which returnsokas a plaintext responseGET /echo?text=<value>- which returnsEcho - {value}as a plaintext response (valueis a variable query param)
You can read my previous post on deploying a web application to App Engine to know more about the details of the deployment process.
Once our application is running, let’s make a couple of requests to the HTTP routes:
# make a get request to /simple-request
curl -v https://my-application.appspot.com/simple-request

# make a get request to /echo
curl -v https://my-application.appspot.com/echo\?text\=hello_world
For this example, let’s assume our App Engine application URL is
https://my-application.appspot.com
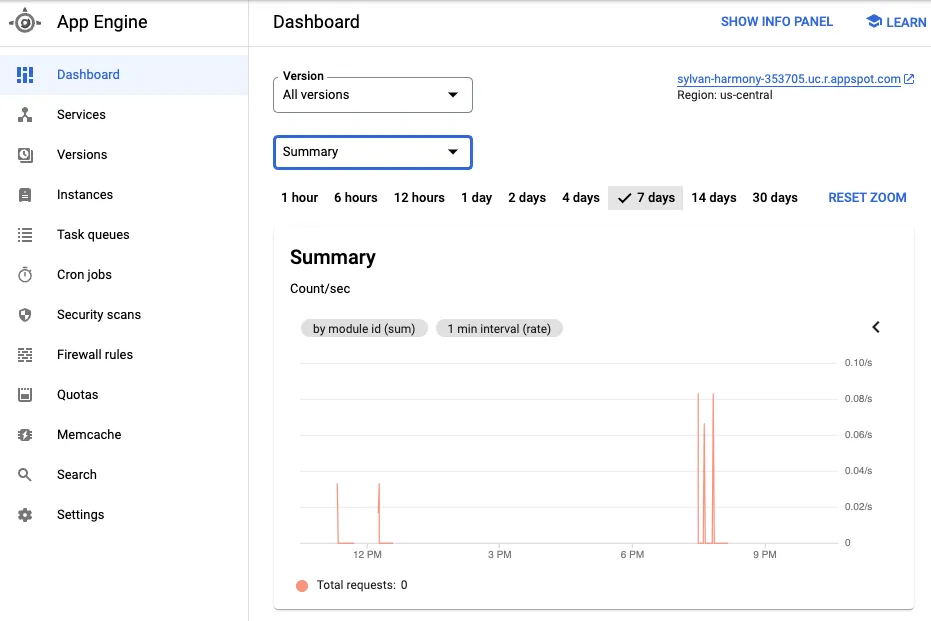
The App Engine Dashboard
For a high-level overview of your application’s metrics, you can view the App Engine dashboard. Here, you can see a summary of all the requests that have come in to your application:
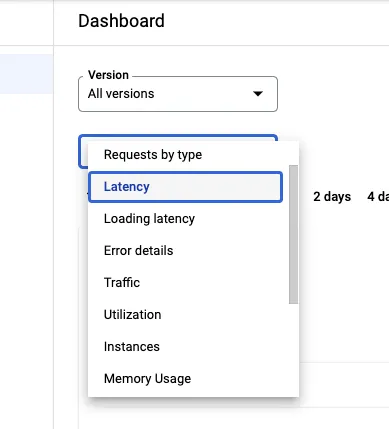
You can also use the drop down to select many other metrics like latency, error rate, and resource usage:
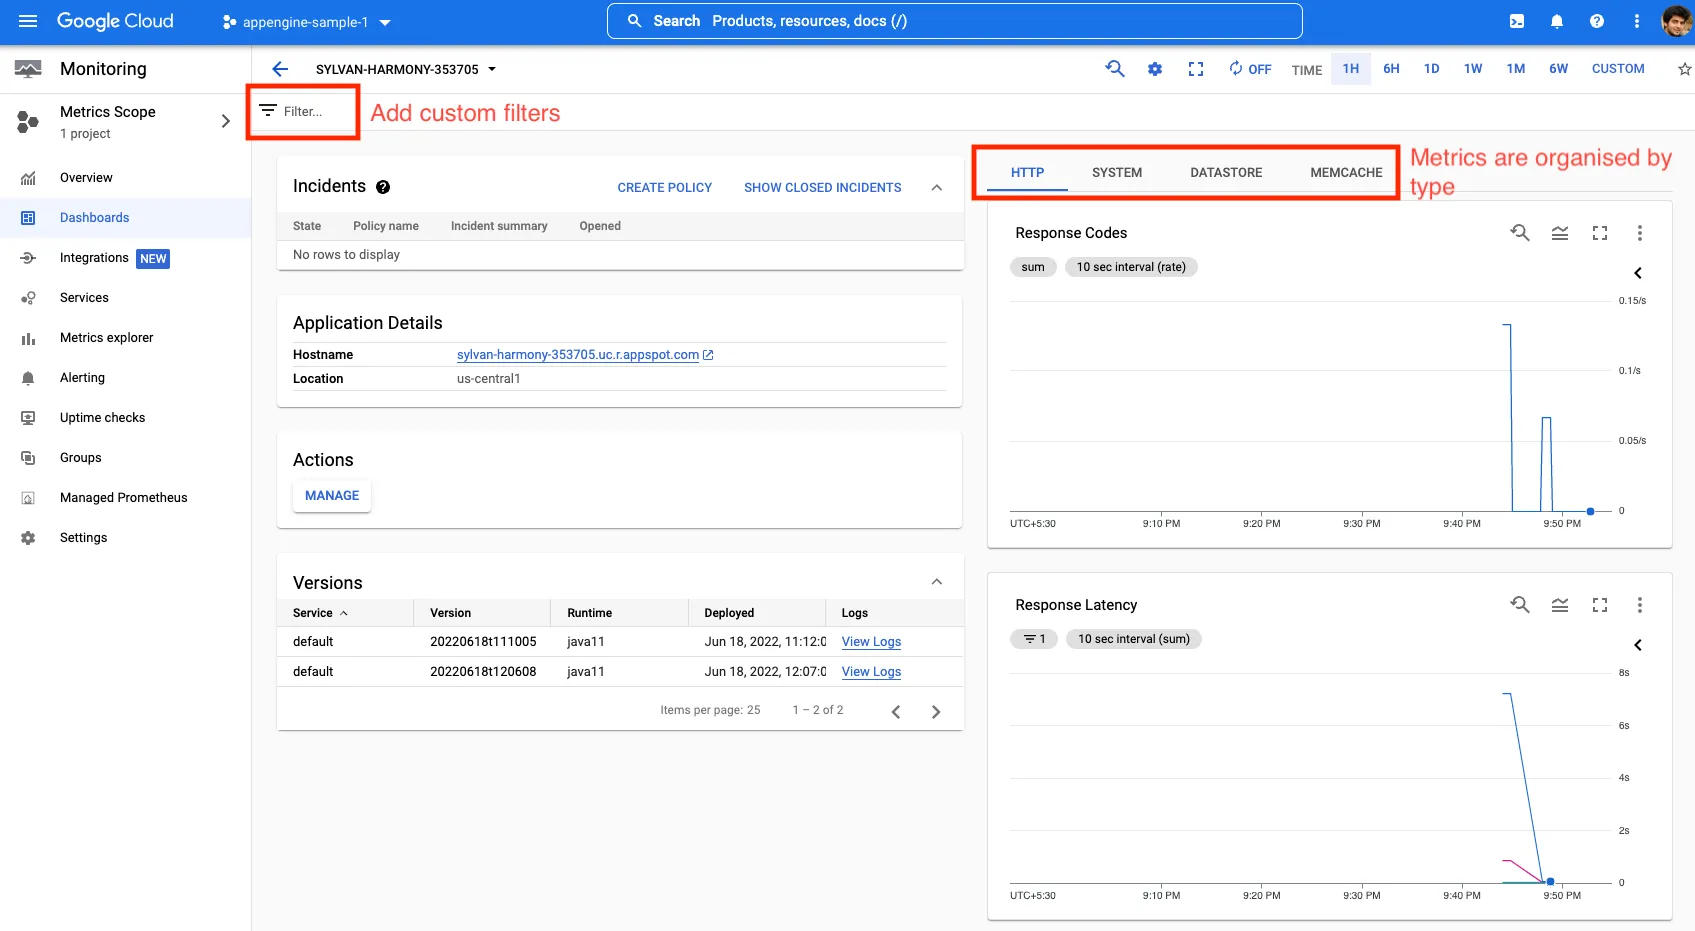
Cloud Monitoring Dashboard
For more detailed metrics, you can go to the Cloud Monitoring dashboard
Here, you can view additional metrics, and even add custom filters for region, status code, or project ID:
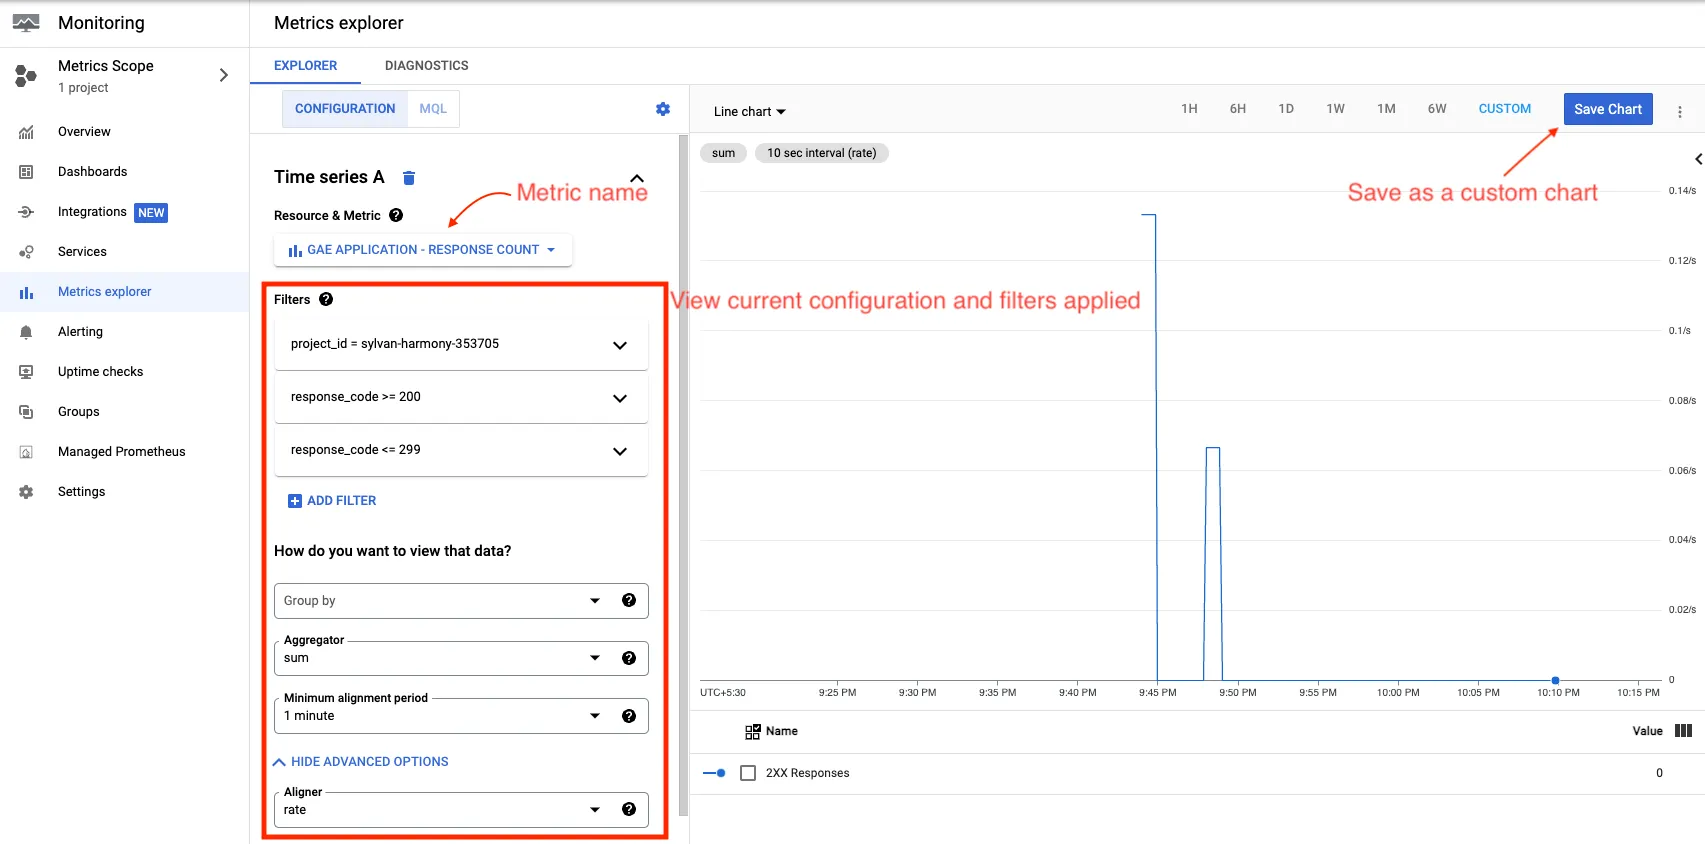
If you want to drill down on any one metric, you can view it in the metrics explorer tab:
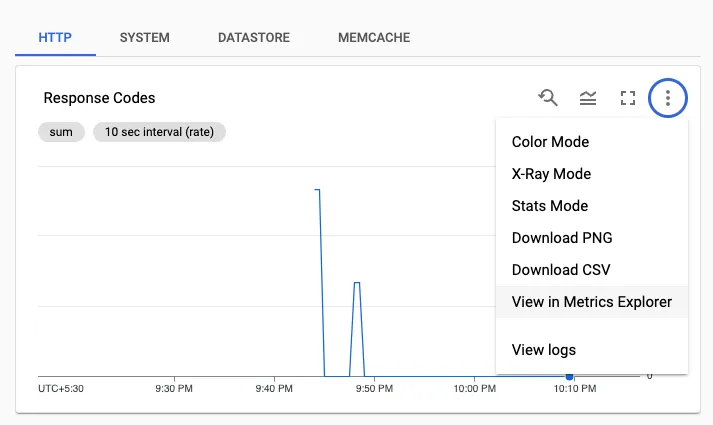
This will show you a detailed view of that chart, which you can modify and save as well:
Creating Alerts
Let’s see how we can trigger an alert if a metric crosses a threshold condition.
Alerts help us by notifying us when our application behaves abnormally. By adding alerts, we don’t have to view our dashboards all day, and can be notified in time if something goes wrong.
As an example, let’s add an alert if the number of HTTP routes returning 500 (Internal server error) status codes goes beyond 100 for any 5 minute interval.
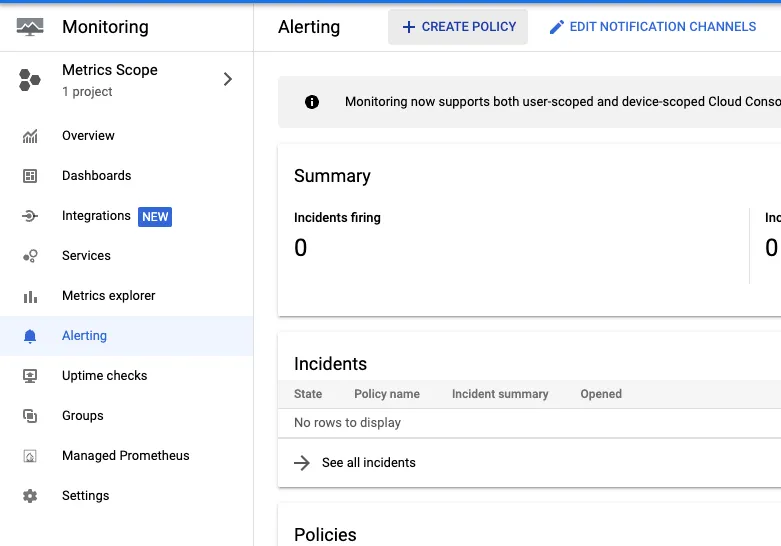
From the metrics explorer dashboard, we saw that the GAE Application - Response Count describes the number of responses by status code. We can now go to the “Alerting” tab on Cloud Monitoring, and create a new policy:
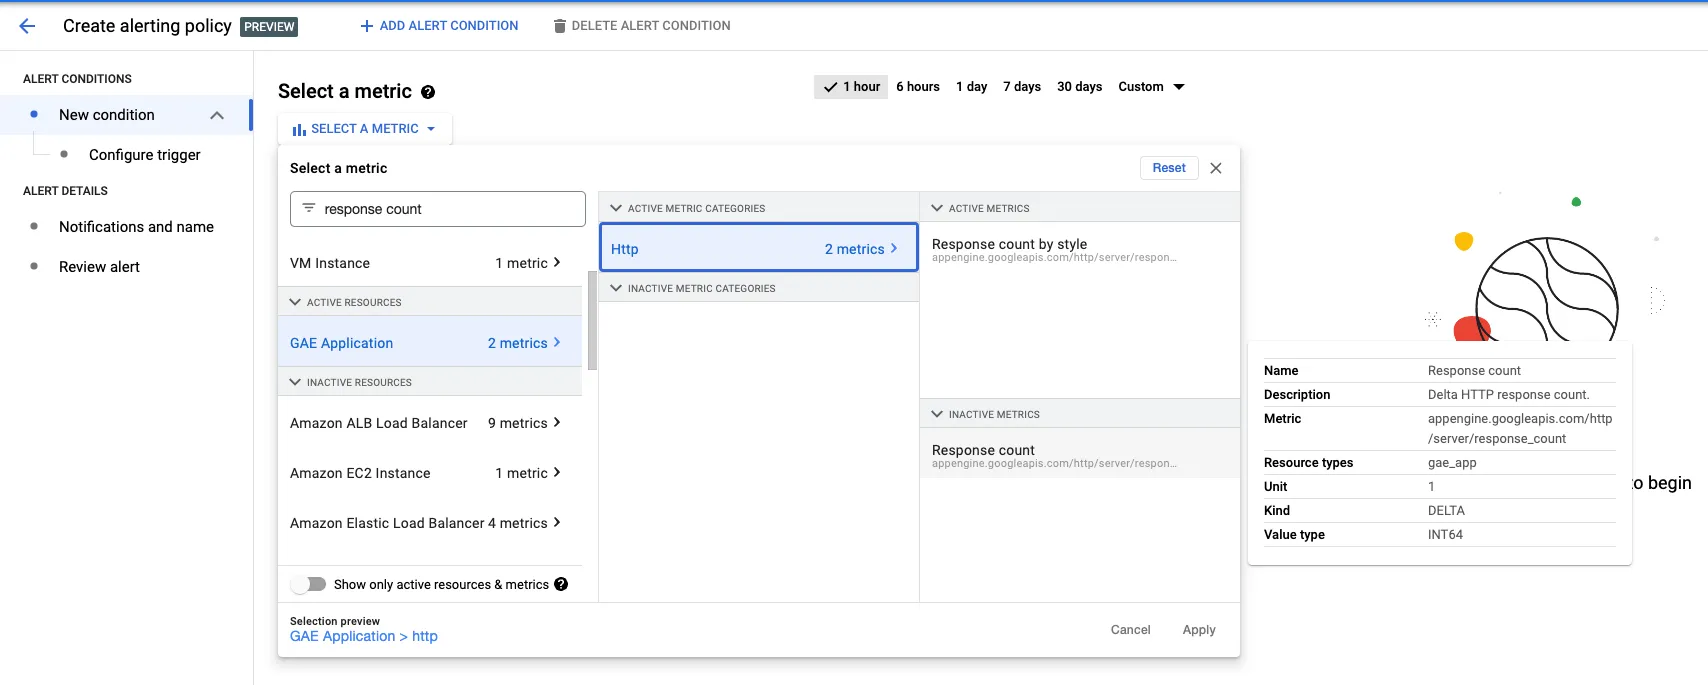
First, let’s select the “Response Count” metric from earlier:
Next let’s add a filter to only consider 500 response status codes. We also want a sum of all such responses over a 5 minute window:
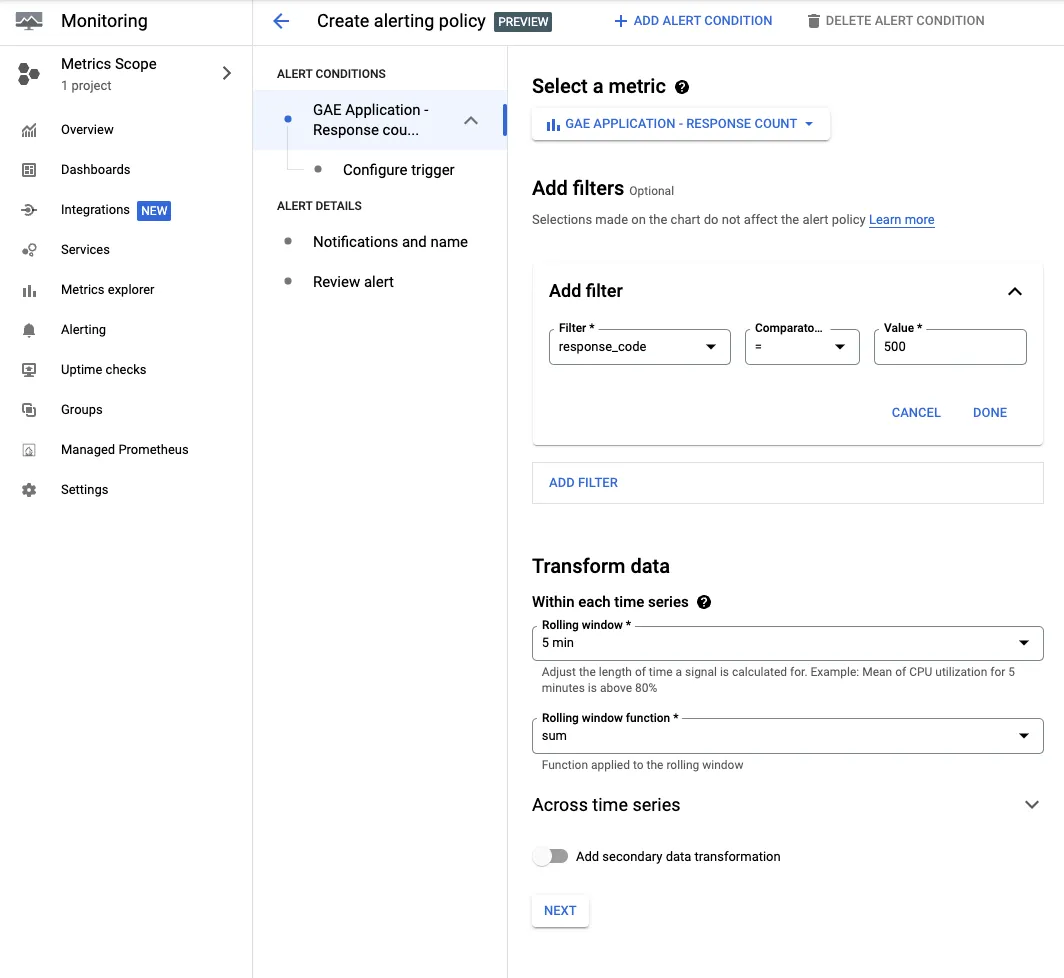
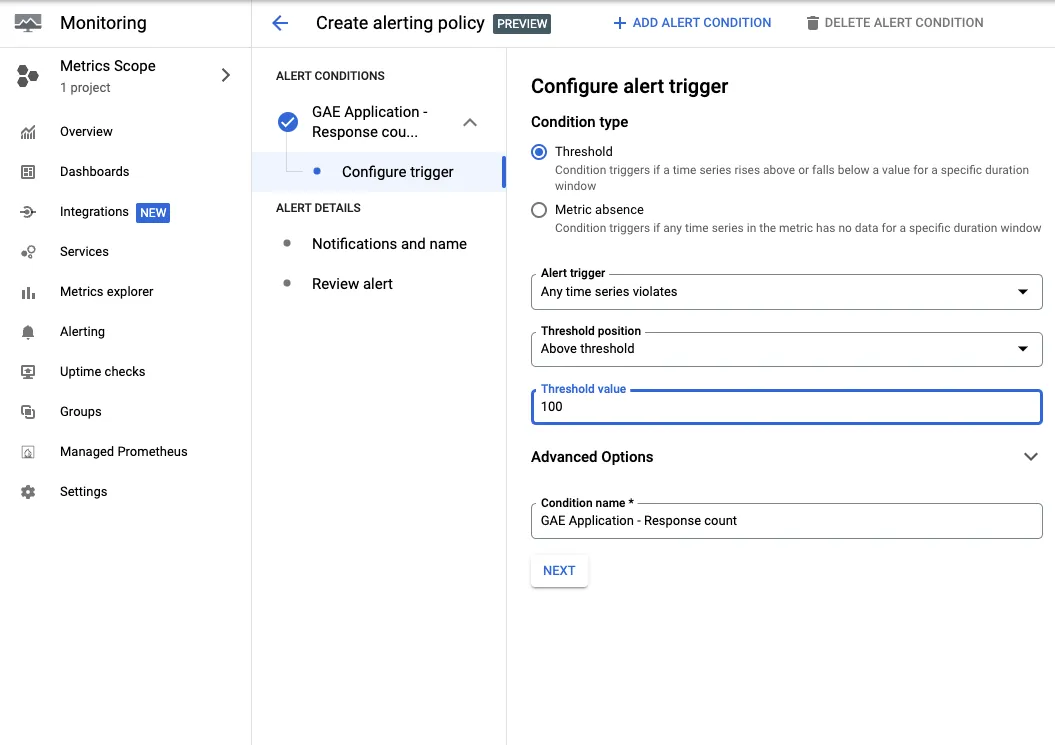
After clicking “Next”, we can configure our trigger for when our selected metric goes above 100 counts at any time over our 5 minute window:
We can then send a notification to an email address every time our metric crosses the threshold condition:
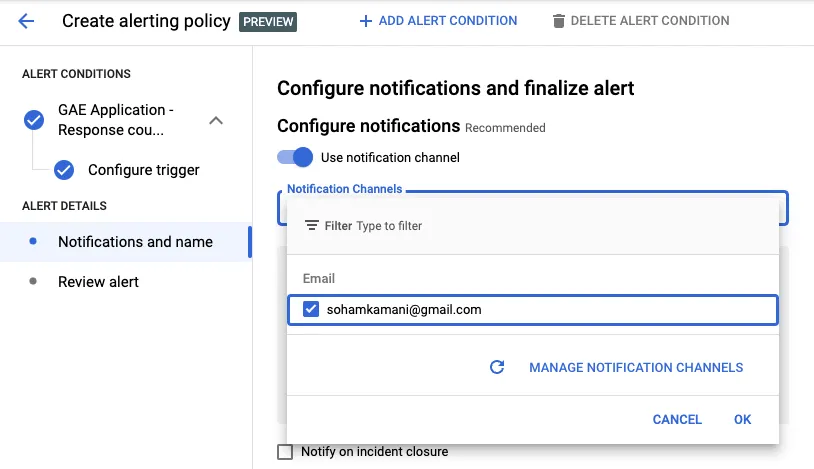
If this is your first time, you’ll have to click on “Manage Notification Channels” and add your email as a notification channel. In addition to email, we can also integrate with other notification channels like Slack, PagerDuty, and mobile/SMS
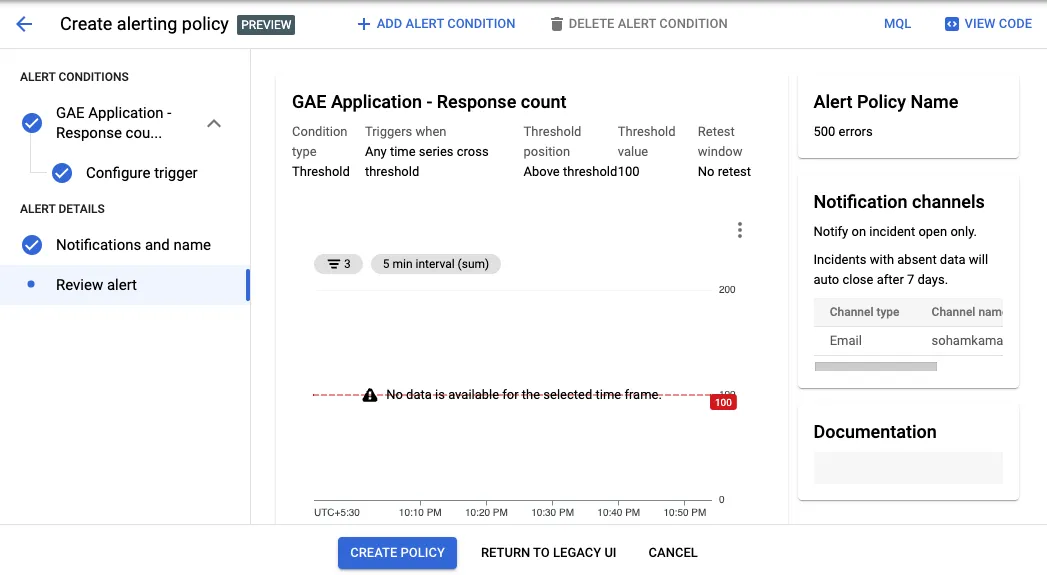
Finally, we can review and create our policy:
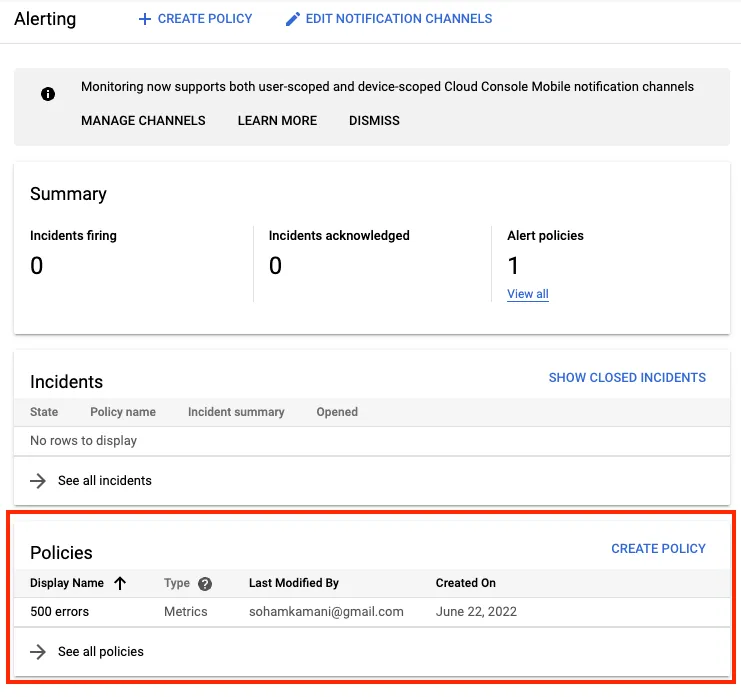
This will now show up as an active policy in the Cloud Monitoring alert dashboard:
Viewing Application Logs
GCP’s command line tools, and Cloud Logging service let’s us explore our application logs. Viewing your logs is essential when you want to debug a problem in more detail, or find out information that can’t be captured as a metric.
Let’s add some logs to our /echo route to see it in action:
@GetMapping("/echo")
public String echo(@RequestParam(name = "text") String echoText) {
	// This logs the echo text to STDOUT
	System.out.println("Input to /echo was: " + echoText);
	return "Echo: " + echoText;
}
Now, every time we call the /echo endpoint, our application will log its query param. Once we deploy this to AppEngine, we can call this endpoint a few times:
curl -v https://my-application.appspot.com/echo\?text\=lorem
curl -v https://my-application.appspot.com/echo\?text\=ipsum
The easiest way to view logs is via the gcloud command line tools. You can view a live stream of your logs by running:
gcloud app logs tail -s defaultWhich outputs the latest logs to our console:
Waiting for new log entries...
2022-06-25 06:27:34 default[20220625t115519]
2022-06-25 06:27:34 default[20220625t115519]    .   ____          _            __ _ _
2022-06-25 06:27:34 default[20220625t115519]   /\\ / ___'_ __ _ _(_)_ __  __ _ \ \ \ \
2022-06-25 06:27:34 default[20220625t115519]  ( ( )\___ | '_ | '_| | '_ \/ _` | \ \ \ \
2022-06-25 06:27:34 default[20220625t115519]   \\/  ___)| |_)| | | | | || (_| |  ) ) ) )
2022-06-25 06:27:34 default[20220625t115519]    '  |____| .__|_| |_|_| |_\__, | / / / /
2022-06-25 06:27:34 default[20220625t115519]   =========|_|==============|___/=/_/_/_/
2022-06-25 06:27:34 default[20220625t115519]   :: Spring Boot ::                (v2.6.4)
2022-06-25 06:27:34 default[20220625t115519]
2022-06-25 06:27:34 default[20220625t115519]  2022-06-25 06:27:34.804  INFO 10 --- [           main] com.sohamkamani.demo.DemoApplication     : Starting DemoApplication v0.0.1-SNAPSHOT using Java 11.0.15 on localhost with PID 10 (/workspace/target/demo-0.0.1-SNAPSHOT.jar started by www-data in /workspace)
2022-06-25 06:27:34 default[20220625t115519]  2022-06-25 06:27:34.807  INFO 10 --- [           main] com.sohamkamani.demo.DemoApplication     : No active profile set, falling back to 1 default profile: "default"
2022-06-25 06:27:36 default[20220625t115519]  2022-06-25 06:27:36.122  INFO 10 --- [           main] o.s.b.w.embedded.tomcat.TomcatWebServer  : Tomcat initialized with port(s): 8081 (http)
2022-06-25 06:27:36 default[20220625t115519]  2022-06-25 06:27:36.136  INFO 10 --- [           main] o.apache.catalina.core.StandardService   : Starting service [Tomcat]
2022-06-25 06:27:36 default[20220625t115519]  2022-06-25 06:27:36.136  INFO 10 --- [           main] org.apache.catalina.core.StandardEngine  : Starting Servlet engine: [Apache Tomcat/9.0.58]
2022-06-25 06:27:36 default[20220625t115519]  2022-06-25 06:27:36.203  INFO 10 --- [           main] o.a.c.c.C.[Tomcat].[localhost].[/]       : Initializing Spring embedded WebApplicationContext
2022-06-25 06:27:36 default[20220625t115519]  2022-06-25 06:27:36.204  INFO 10 --- [           main] w.s.c.ServletWebServerApplicationContext : Root WebApplicationContext: initialization completed in 1322 ms
2022-06-25 06:27:36 default[20220625t115519]  2022-06-25 06:27:36.978  INFO 10 --- [           main] o.s.b.w.embedded.tomcat.TomcatWebServer  : Tomcat started on port(s): 8081 (http) with context path ''
2022-06-25 06:27:37 default[20220625t115519]  2022-06-25 06:27:37.015  INFO 10 --- [           main] com.sohamkamani.demo.DemoApplication     : Started DemoApplication in 2.989 seconds (JVM running for 4.09)
2022-06-25 06:27:37 default[20220625t115519]  2022-06-25 06:27:37.080  INFO 10 --- [nio-8081-exec-2] o.a.c.c.C.[Tomcat].[localhost].[/]       : Initializing Spring DispatcherServlet 'dispatcherServlet'
2022-06-25 06:27:37 default[20220625t115519]  2022-06-25 06:27:37.081  INFO 10 --- [nio-8081-exec-2] o.s.web.servlet.DispatcherServlet        : Initializing Servlet 'dispatcherServlet'
2022-06-25 06:27:37 default[20220625t115519]  2022-06-25 06:27:37.082  INFO 10 --- [nio-8081-exec-2] o.s.web.servlet.DispatcherServlet        : Completed initialization in 1 ms
2022-06-25 06:27:37 default[20220625t115519]  Input to /echo was: hello_world
2022-06-25 06:28:03 default[20220625t115519]  "GET /echo?text=lorem HTTP/1.1" 200
2022-06-25 06:28:03 default[20220625t115519]  Input to /echo was: lorem
2022-06-25 06:28:09 default[20220625t115519]  "GET /echo?text=ipsum HTTP/1.1" 200
2022-06-25 06:28:09 default[20220625t115519]  Input to /echo was: ipsum
We can also open the Logs Explorer dashboard to get a more detailed view:
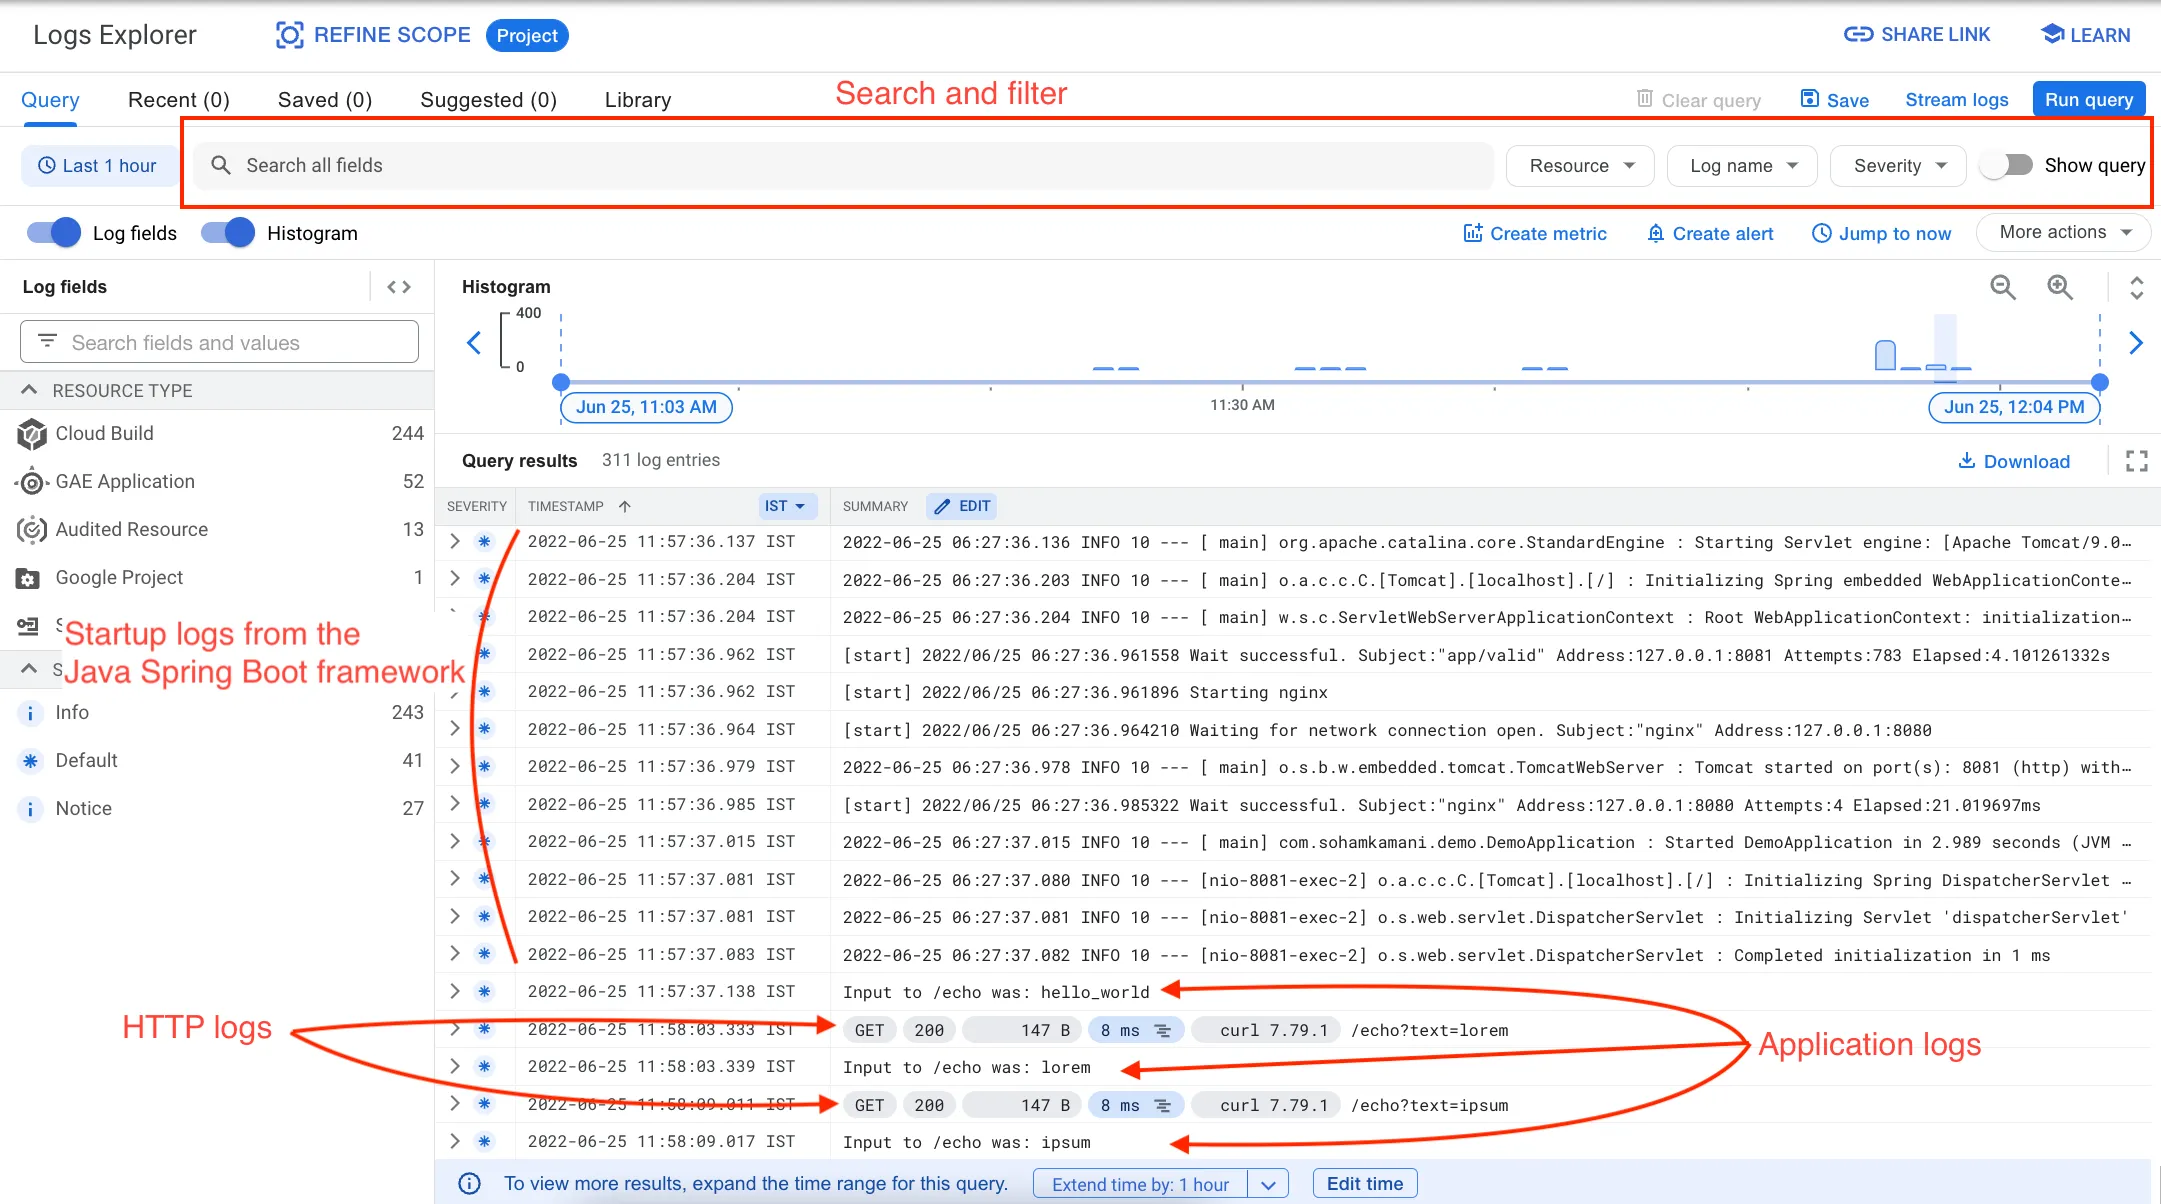
Here, we can see different types of logs:
- Logs that are printed by the
System.out.printlnstatement in our code - Startup logs from the Java Spring Boot framework
- HTTP logs, which give us information about the HTTP route, method, status and latency
We can use these logs to get an idea of our applications functioning for every single request — something that we cannot do with dashboards alone.
Filtering Logs
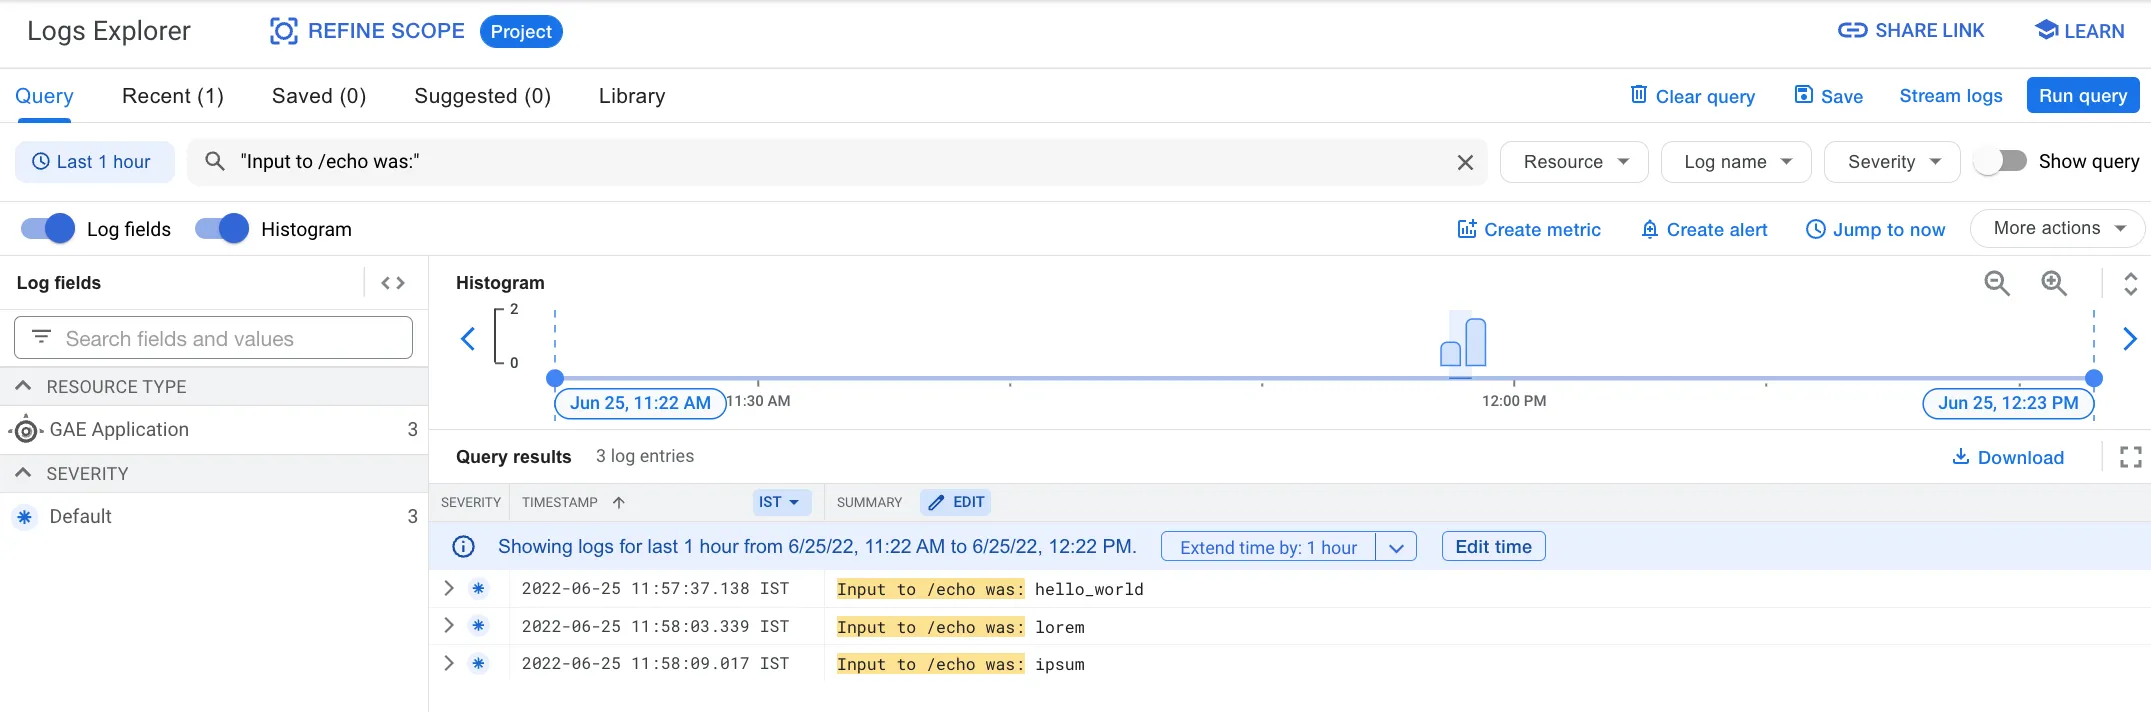
We can use the Logs Explorer dashboard to filter out logs that are important to us.
For example, if we only want to see the Input to /echo ... logs printed by our application, we can add a query to filter them out:
Let’s look at some more advanced filtering queries. If we expand any log entry, we can see that it’s made up of a JSON payload with multiple fields:
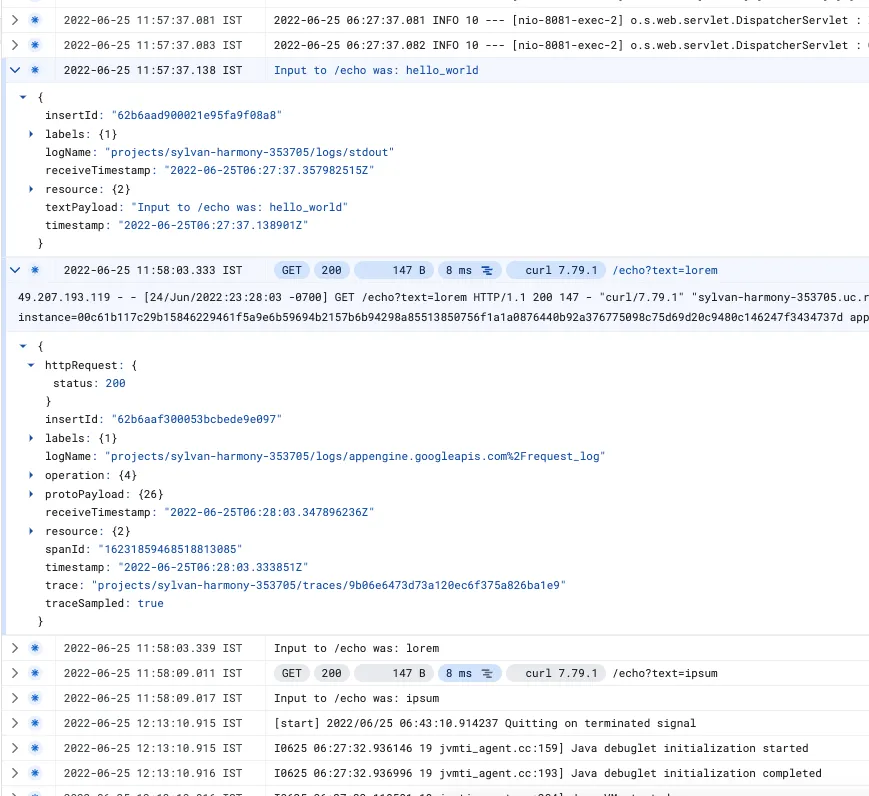
We can filter based on these fields based on our requirements. For example, the HTTP logs have a field called httpRequest.status which contains the response status of that request.
We can add a filter condition to only show logs for requests with a response status of 200:
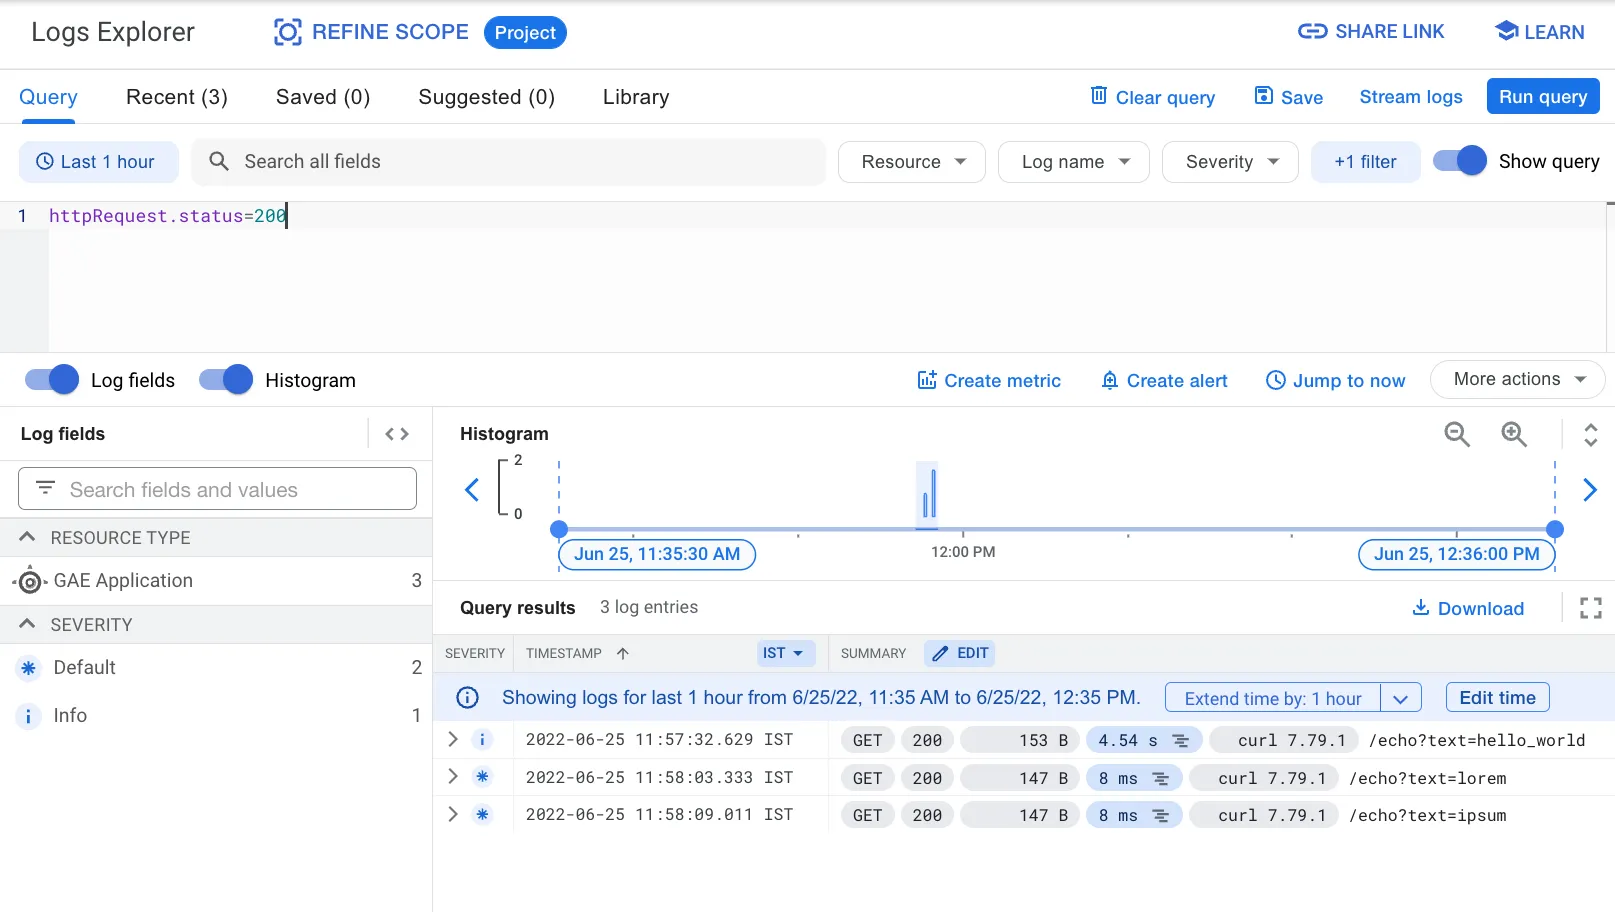
Here, we’ve added the query httpRequest.status=200 - this filters all entries whose JSON structure looks like:
{
	"httpRequest" : {
		"status": 200
	}
}
You can read more about all the different types of queries you can execute in the documentation page.
Conclusion
Monitoring is an essential requirement as your application scales. This tutorial covered multiple tools for monitoring your AppEngine application:
- We should use dashboards in Cloud Monitoring for a high level view of your applications performance and error rate.
- If we want to get proactive notifications when something goes wrong, we can create alerts on top of a dashboard metric.
- For a more in-depth view and per-request granularity, use Cloud Logging to view and filter your application logs.
If we correctly monitor our application, we can fix most issues before they affect our users, and in some cases, even prevent them before they occur.