Table of Contents
D3 is used extensively for drawing geographic visualizations. D3 uses GeoJSON for representing shapes on maps. This post explains how we can use D3 to convert GeoJSON, that looks like this:
{
  "type": "FeatureCollection",
  "features": [{
    "type": "Feature",
    "properties": {
      "subunit": "Albania",
      "su_a3": "ALB",
      //...
      //...
    },
    "geometry": {
      "type": "Polygon",
      "coordinates": [
        [
          [20.590247430104906, 41.855404161133606],
          // ...
          [20.590247430104906, 41.855404161133606]
        ]
      ]
    }
  }
into a rendered SVG element, that looks like this:
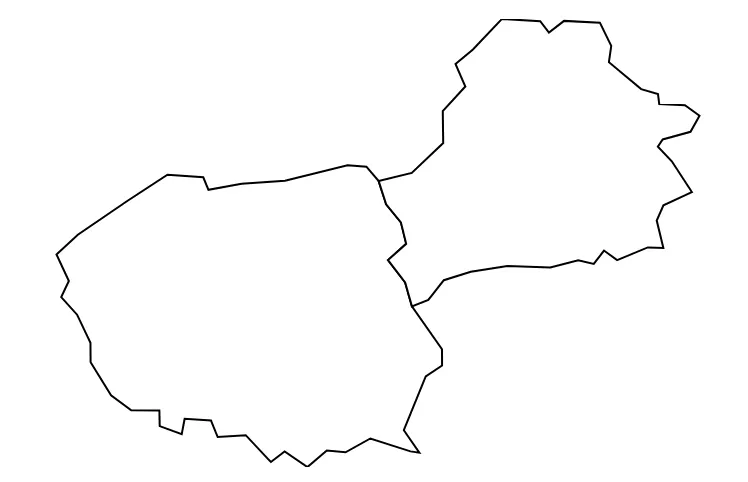
First, the code
Before we get into the details, let’s take a brief look at the code that produced the above image:
// Append an SVG element to the body, and assign "map" as its ID
const svg = d3
	.select("body")
	.append("svg")
	.attr("id", "map")
// Get the height and width, in pixels for the SVG element in the document
const { height, width } = document.getElementById("map").getBoundingClientRect()

// Create a new projection function
const projection = d3.geoAlbers()
// Adjust the projection to fit the width and height of the SVG element
projection.rotate(-75).fitExtent(
	[
		[0, 0],
		[width, height],
	],
	features
)

// Create a GeoPath function from the projection
const path = d3.geoPath().projection(projection)

// Append paths to the SVG, and decribe its 'd' attribute using the geo-path function
svg.append("g")
	.selectAll("path")
	// Here, "features" is the GeoJSON snippet that we saw earlier
	.data(features.features)
	.enter()
	.append("path")
	.attr("d", (feature) => path(feature))
There’s a LOT going on here. And at first glance, it isn’t obvious what each line of code is doing.
What is a projection?
As most of us know, the earth is round… but we’re also trying to show it’s features on a flat surface (i.e. our computer screen). Since it’s not mathematically possible to accurately translate a sphere onto a plane, we need to use projections.
A projection, as the name suggests, “projects” the features on a globe, so that they can be drawn as images on our screen.
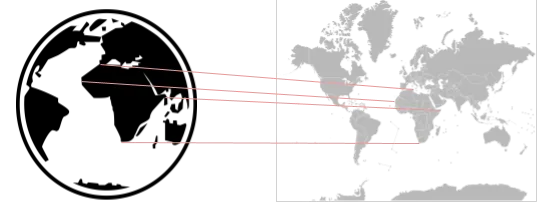
This often leads to some inaccuracies.
The mercator projection shown in the above image, for example, is famously known to over-exaggerate the size of landmasses near the poles (I mean, just look at Greenland!)
In the end, there is no projection that accurately depicts all points in the globe, so it’s best to choose the appropriate projection for your use case. For a full list of projections supported in D3, you can visit it’s documentation page.
Projection functions in D3
In our code, we initialized a new Albers projection function with:
const projection = d3.geoAlbers()The purpose of the function is actually really straightforward: translate a lattitude and longitude pair to a pair of X,Y coordinates on our SVG. Let’s try this out with some random input pairs:
> projection([0,0])
Array [ 2235.9363494308823, -24.594281642375563 ]
> projection([12,100])
Array [ 1140.403989940912, -819.3928208551474 ]
> projection([12,-2])
Array [ 2389.112163974903, -239.9312192050636 ]
The input pair is in the format
[longitude, latitude], and the output is of the form[x, y]
We got some X, Y coordinates as output, but theres something missing: the projection has no knowledge of the size or extent of our SVG element. Naturally, if our SVG image was of size 300x400, every single coordinate in the above example would fall off the image, and not be seen.
This is where the rotate and fitExtent methods come in.
rotatedescribes how much the point must rotate relative to its original position. There is no “right” value for the rotation, and so this is often chosen by trial and error, according to what the user finds more visually pleasing.fitExtentdescribes the minimum and maximum coordinates that the output needs to be bound to. In this case, this would be decided by the size of SVG. ([0,0]as the minimum and[width, height]of the SVG as maximum). It also takes the features as the second argument. The resulting projection scales the minimum and maximum coordinates of the features, to the minimum and maximum coordinates of our SVG, to give us a projection for a perfectly fitted map.
So when we write:
projection.rotate(-75).fitExtent(
	[
		[0, 0],
		[width, height],
	],
	features
)
We want the projection to fit the bounds of all the countries described by features, into a rectangle with the bounds of (0,0) as the top left corner and (width, height) as the bottom right corner.
Now the projection function can map any coordinate to the bounds that we defined.

Geopaths
The projection function works great for converting points into X and Y coordinates… but what about lines? After all, countries are represented by lines on a map, and not by individual points. If we’re using an SVG, irregular lines are represented using the path element. Here’s what a path element looks like for one of the countries above:
<path
	d="M732.4944016581658,608.9022205707863L727.1354648887938,
610.9411167803873L706.8155159265721,604.6447353677604L703.587646715891,
610.7806528270128L688.0319490712842,611.8868016539795L688.8280117925813,
......
......
......
600.4706783128443L788.2046582778905,605.2215195516151L781.7980088643487,
600.5439608373076L772.9856281618564,600.8681045994042L760.5726799028025,
607.2632255686299L744.3618779892297,607.9935254189165L742.5384536592165,
615.3237961667451Z"
	stroke="white"
	fill="rgb(211, 211, 211)"
></path>
The d attribute decides the shape of the line. You can go here to know more about the path definition.
We could use the projection function to go through each polygon coordinate in our GeoJSON file and finally build up the d attribute of the path… or, we could use some D3 magic!
The d3.geopath function takes our projection, and returns another function that can be used to generate the d attribute for the path element.
// Create a GeoPath function from the projection
const path = d3.geoPath().projection(projection)
path is now a function which accepts GeoJSON polygons, and returns a string which can directly be used as the d attribute of an SVG path.

Putting it all together
Now that we have a function that converts a GeoJSON object to an SVG element, let’s take a moment to think of what needs to be done to draw a map containing multiple countries, given that we have an array of GeoJSON polygons with their coordinates.
- Loop through each country’s GeoJSON polygon
- Create the
dattribute string using the geopath function - Create and append an SVG
pathelement with the abovedattribute
This is what the last part of our code does:
svg.append("g")
	.selectAll("path")
	// `features.features` is the list of country's polygons
	.data(features.features)
	.enter()
	// Everything after the `enter` method executes for each polygon
	// we append a path element...
	.append("path")
	// ... and assign the d attribute by running the path function
	// with the feature as the argument
	.attr("d", (feature) => path(feature))
And with that, you should have a map drawn out on your SVG!
I’ve made a working example, which you can view here. The source code for this example is on Github
Here are some other simple examples that use projections to draw out maps: